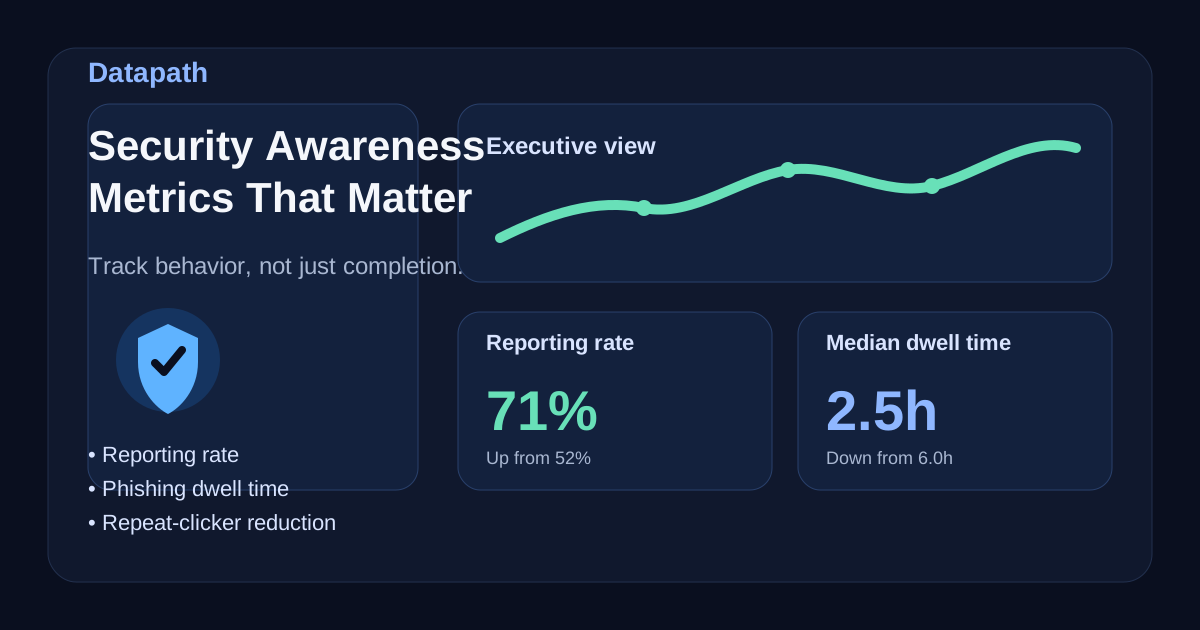

What security awareness KPIs and metrics should IT leaders track?
The best security awareness KPIs and metrics are the ones that show whether people are getting better at recognizing, reporting, and avoiding real threats. For most CISOs and IT leaders, the core KPI set should include reporting rate, time to report, real-threat reporting, click and credential-submission rate, repeat-risk reduction, miss rate, and training completion SLA.12
Completion still matters for audits. It should not be the headline. NIST’s current guidance for cybersecurity and privacy learning programs emphasizes behavior change, risk management, and ongoing program improvement, not just proof that a module was assigned.1 A company can hit 99% completion and still have users who ignore suspicious emails, delay reporting, or repeat the same mistake under pressure.
That is where many awareness programs go sideways. The organization measures what is easy to export from the LMS instead of what helps reduce human-driven risk. If leadership wants to know whether the program is worth the budget, the answer is not hidden in completion screenshots. It is in behavior.
For page-two searchers asking about KPIs for security awareness, the short answer is this: use completion as the compliance floor, then lead the dashboard with behavior KPIs. The useful scorecard is not “who watched the video.” It is who reported suspicious messages, how fast they reported, which risky actions fell after coaching, whether real employee reports produced security action, and which departments still need manager follow-up.
Need managed security awareness metrics?
Datapath helps teams turn training, phishing, Microsoft 365 reporting, repeat-risk coaching, and executive dashboards into a measurable cybersecurity operating rhythm.
Which security awareness KPI matches your search intent?
Security teams use different phrases for the same problem: how to prove that awareness training is changing behavior. Use this table to map common searches to the metric that actually answers the question.
| If your search sounds like this | Metric to use first | What it proves |
|---|---|---|
| ”security awareness training effectiveness metrics” | Reporting rate, time to report, repeat-risk reduction | Employees are recognizing threats and acting faster |
| ”CISO metrics for security awareness training” | Executive scorecard with trends, cohorts, and risk actions | Leadership can see whether risk is moving |
| ”benchmarks for training completion and click rates” | Completion SLA plus baseline-to-current click and submit rates | The program is reaching employees and reducing risky actions |
| ”human risk metrics for security awareness” | Repeat-risk, miss rate, risky-action rate, real-threat reports | The organization can identify people, roles, or workflows that need support |
| ”metrics for phishing training tools” | Simulation reporting, credential submission, report quality, integration data | The tool is measuring useful behavior, not only campaign activity |
| ”security awareness metrics for board reporting” | Four to six outcome KPIs with trend lines and risk decisions | The board sees progress, exposure, and next actions |
| ”KPIs security awareness” | Completion SLA, reporting rate, time to report, risky-action rate, and repeat-risk reduction | IT can separate compliance evidence from actual behavior change |
| ”gamified security awareness metrics” | Participation, improvement by cohort, report quality, risky-action reduction | Game mechanics are reinforcing safer behavior instead of rewarding vanity points |
When should metrics become a managed security awareness service?
Security awareness metrics should become a managed service when the organization can export training data but cannot consistently turn it into phishing response, coaching, Microsoft 365 follow-up, manager actions, audit evidence, and executive reporting. A managed model is useful when human-risk data needs owners, cadence, and remediation instead of another spreadsheet.
| Trigger | What managed security awareness should add |
|---|---|
| Training completion is high but reporting is weak | Reporting friction review, phishing report-button workflow, and manager reinforcement |
| Repeat risky actions keep appearing | Coaching paths, role-specific examples, and recurring behavior trend reporting |
| Phishing simulation data does not reach security operations | Ticketing, Microsoft 365, email-security, and incident-response handoffs |
| Leadership wants board-ready cyber metrics | Short KPI scorecards with trends, cohorts, decisions, and open remediation owners |
| Auditors or insurers ask for awareness evidence | Completion, exceptions, simulation results, coaching records, and policy-aligned evidence |
Datapath’s security awareness training services connect the KPIs in this guide to managed cybersecurity operations, phishing reporting, Microsoft 365 signals, and executive-ready reporting. Teams that want the reporting to drive real response can also connect the scorecard to managed cybersecurity services so repeat-risk coaching, suspicious-message review, ticketing, and leadership reporting have owners.
Why completion rates are not enough
Completion metrics are useful as compliance proof, but they are weak as a risk metric. They show that training was delivered. They do not prove that employees can identify a suspicious request, report it through the right channel, or avoid a credential-harvesting page when work is busy.2
That distinction matters because security awareness programs are supposed to improve operational outcomes, not just satisfy procurement, insurance, or audit requirements. If an employee completes annual training and still waits six hours to report a phishing email, the organization has a real detection problem even though the dashboard looks green.
Completion data is still helpful for proving training coverage, identifying teams that are not participating, supporting audit evidence, and tracking onboarding. It belongs in the scorecard, just not at the top.
Which metrics actually show risk reduction?
The most useful metrics connect awareness training to real user behavior. NIST’s CSF 2.0 places awareness and training in the Protect function so personnel can perform cybersecurity-related tasks, and NIST research on awareness measurement found that completion rates often do not show whether behavior and attitudes changed.23
For a practical program, start with this stable KPI set:
| Metric | What to measure | Why it matters |
|---|---|---|
| Reporting rate | Percentage of users who report simulated or real suspicious messages | Measures active defense, not just avoidance |
| Time to report | Median and 90th percentile time from message delivery to first report | Shows whether the security team gets usable warning quickly |
| Real-threat reporting | Volume and quality of employee reports for non-simulated threats | Shows whether training transfers into daily work |
| Click and submit rate | Clicks, attachment opens, macro enables, credential submissions, or QR-code scans | Shows risky actions, especially when tracked by scenario type |
| Repeat-risk reduction | Reduction in repeat failures after coaching or role-specific training | Shows whether intervention works for high-risk users |
| Miss rate | Users who neither clicked nor reported | Reveals silent non-participation and reporting friction |
| Incident trend alignment | Incidents or tickets related to trained topics | Connects awareness activity to operational security outcomes |
| Completion SLA | Completion within required time frames by role, location, and department | Supports audits and identifies coverage gaps |
Reporting rate
Reporting rate measures how often employees correctly identify and report suspicious messages. This is one of the strongest positive-behavior indicators because it captures participation in detection. A higher reporting rate tells you employees are not just avoiding clicks. They are helping the security team find threats earlier.
Separate simulation reporting from real-threat reporting. A team that performs well in simulations but rarely reports real messages may need a clearer reporting button, better reinforcement from managers, or more realistic scenarios.
Time to report
Time to report measures how long it takes from message delivery to the first employee report. Shorter time to report gives security teams more time to investigate, contain, warn others, and block related activity before it spreads.
Use median and 90th percentile, not just average. The median shows normal behavior. The 90th percentile shows whether a long tail of late reporters still creates risk.
Real-threat reporting
Simulation metrics matter, but real-world reporting matters more. Real-threat reporting shows whether employees apply training outside the lab. CISA’s phishing guidance tells users to recognize suspicious signs, resist clicking, report the message, and delete it.4
This is often where awareness teams learn whether training transfers into daily work. Track useful reports, false positives, report quality, and whether reported messages produced security actions such as tenant-wide search, sender blocking, account review, or incident tickets.
Repeat-risk reduction
The goal of awareness training is improvement, not public shaming. Repeat-risk reduction shows whether high-risk users, departments, or workflows improve after targeted coaching, micro-training, manager reinforcement, or control changes.
If the same people or teams keep failing, the program probably needs a better remediation model. More generic annual content will not fix a workflow where employees are pressured to approve urgent payments, handle sensitive data quickly, or accept vendor requests without verification.
Miss rate
Miss rate tracks the percentage of users who neither click nor report. This matters because it highlights invisible risk. People in this category are not obviously failing, but they are not helping either.
A high miss rate can point to low engagement, poor reporting UX, uncertainty about what counts as suspicious, or a culture where employees worry that reporting will create blame.
What benchmarks should security teams use for completion and click rates?
Security teams should use benchmarks carefully. Universal click-rate comparisons are easy to misuse because campaign difficulty, message realism, audience risk, reporting tools, and prior training maturity all change the result.
Use these as a practical starting point:
| Benchmark area | Practical target | How to interpret it |
|---|---|---|
| New-hire training | Completed during onboarding; CISA’s CPGs call for initial cybersecurity training within 10 days | Reduces the gap between account creation and first exposure |
| Annual training | At least annual training for employees and contractors, aligned to CISA’s CPG baseline | Supports coverage, audit evidence, and shared expectations |
| Completion SLA | 95% or better within your internal deadline, with named owners for exceptions | Measures program reach, not behavior change |
| Click rate | Improve against your own baseline by scenario and cohort | Useful trend metric, but not a standalone success measure |
| Credential submission | Track separately from simple clicks | Better signal for high-risk behavior |
| Reporting rate | Should rise over time and be segmented by role, location, and department | Shows active participation in detection |
| Time to report | Median and 90th percentile should fall over time | Shows faster detection and containment opportunity |
| Repeat-risk | Repeat risky actions should fall after targeted coaching | Shows remediation is working |
CISA’s Cybersecurity Performance Goals are a useful floor for training cadence, not a full measurement system. The measurement system should show whether employees are learning and performing safer behaviors.5
What should CISOs report to executives and the board?
Executives usually do not want a giant metric dump. They want a short answer to a simple question: Is this making us safer?
That means security awareness reporting should connect metrics to risk, not just activity. A CISO scorecard should usually include:
- completion coverage for required audiences
- reporting rate and time-to-report trend
- click, submit, and miss rate by campaign type
- repeat-risk cohort trend after remediation
- real-threat reports that led to security action
- high-risk departments, roles, or locations that need manager involvement
- open remediation items, owners, and due dates
The board version should be even simpler:
| Board question | Awareness metric that answers it |
|---|---|
| Are employees being trained? | Completion SLA by audience and exception count |
| Are employees helping detection? | Reporting rate, real-threat reports, and time to report |
| Are risky behaviors going down? | Click, submit, miss, and repeat-risk trends |
| Are high-risk groups improving? | Cohort-level improvement after intervention |
| Is the program changing operations? | Tickets, blocked campaigns, incident lessons, and control improvements tied to reports |
A better executive narrative sounds like this: reporting improved, median time to report fell, repeat risky actions dropped in the finance team after targeted coaching, and employee reports triggered two tenant-wide phishing searches before widespread impact. That is more useful than saying everyone watched a video.
How should managers use security awareness KPIs?
Managers should not receive a wall of security data. They should receive a short, actionable view of the behaviors they can influence.
Useful manager-level metrics include:
- completion exceptions by team
- users who need follow-up coaching
- risky workflow patterns, such as payment approvals or sensitive-data handling
- reporting participation by team
- whether coaching or process changes reduced repeat risk
- how quickly the team reports real suspicious messages
Manager accountability matters because many awareness failures are not just knowledge failures. They are workflow, pressure, and reinforcement failures. A payroll team, help desk, clinical operations group, school office, or finance team may need different examples, controls, and escalation paths.
What should security awareness vendors and providers be able to report?
When evaluating a security awareness training provider, do not stop at the course catalog. Ask what metrics the provider can produce, how those metrics integrate with your security stack, and whether the program supports executive reporting.
Ask these questions before signing:
| Provider question | Why it matters |
|---|---|
| Can you measure reporting rate, miss rate, click rate, and credential-submission rate separately? | Prevents one shallow campaign score from hiding useful behavior |
| Can you show real-threat reports, not only simulation reports? | Shows whether the program transfers into production |
| Can you segment by department, role, location, privileged users, and high-risk cohorts? | Helps managers act instead of averaging risk away |
| Can you integrate with Microsoft 365, email security tools, ticketing, SIEM, or MDR workflows? | Turns reports into security actions |
| Can you track remediation after repeat risky actions? | Shows whether coaching works |
| Can you provide board-ready summaries and manager-ready views? | Keeps reporting useful for different audiences |
| Can you document training cadence, completion exceptions, and evidence for audits? | Supports compliance, insurance, and governance needs |
For organizations that rely on managed IT or managed cybersecurity partners, the better question is not “Do you provide training?” It is “Can you connect training, phishing reports, email security, incident response, identity controls, and executive reporting into one operating rhythm?”
What metrics can be tracked in gamified security awareness programs?
Gamification can help if it reinforces the right behavior. It can also create noise if the program rewards points, badges, or leaderboard activity without reducing risk.
For gamified programs, track:
- participation by team and role
- improvement from each team’s own baseline
- accurate reporting of suspicious messages
- reduction in clicks, credential submissions, and repeat risky actions
- quality of reports, not just quantity
- manager follow-through after coaching
- retention of safe behavior after the campaign ends
Avoid rewarding employees for reporting every message blindly. That can overload security teams and train the wrong habit. Better gamified programs reward accurate reports, timely reports, and team improvement.
How do you build a practical measurement framework?
The cleanest way to start is to build a baseline, not a perfect dashboard. A practical 90-day framework looks like this:
| Time frame | What to do | Output |
|---|---|---|
| Days 1-15 | Confirm audiences, required training cadence, reporting paths, and data sources | Measurement scope and owner list |
| Days 16-30 | Baseline completion, reporting, click, submit, miss, and time-to-report data | Starting KPI dashboard |
| Days 31-45 | Segment by department, location, role, privileged access, new hires, and high-risk cohorts | Risk heat map |
| Days 46-60 | Run targeted training or simulations tied to actual threat patterns | Behavior-change evidence |
| Days 61-75 | Coach repeat-risk users and fix reporting friction | Remediation tracker |
| Days 76-90 | Present executive scorecard with trends, decisions, and next actions | CISO-ready awareness report |
Metrics without action are decoration. If reporting rate drops, the team should know what intervention follows. If one group has a stubbornly high miss rate, the response might be a manager conversation, a workflow change, a better report button, or a more realistic scenario.
What does a mature awareness program look like?
A mature security awareness program has a few recognizable traits:
- completion data is tracked, but demoted below behavior metrics
- new-hire and annual training are handled reliably
- reporting is easy, visible, and encouraged
- real employee reports feed security operations
- repeat risky actions trigger coaching instead of only punishment
- awareness metrics are segmented by role, department, location, and privileged access
- leadership can explain how the program supports business resilience, not just compliance
- security teams can show what changed because of the metrics
This is also where awareness work starts overlapping with broader cybersecurity operations. If your team is already tightening phishing response, identity hygiene, and incident playbooks, awareness metrics should complement that work rather than sit in a disconnected spreadsheet. Teams looking at broader maturity often pair this with guidance on security awareness training services, Microsoft 365 phishing protection, managed cybersecurity services, security awareness training frequency, and cyber incident response tabletop exercises.
Why Datapath for security awareness metrics and reporting?
Datapath helps regulated and mid-market organizations make cybersecurity reporting operational. Security awareness metrics should not live in isolation from email security, Microsoft 365 hardening, endpoint protection, incident response, help desk workflows, and executive risk reporting.
If your organization needs a clearer way to measure human risk, report security awareness KPIs to leadership, or evaluate whether a provider is doing more than assigning videos, review Datapath’s security awareness training services or talk with Datapath about a security awareness and cybersecurity reporting review.
FAQ: Security awareness training metrics
What are the best KPIs for security awareness?
The best KPIs for security awareness are reporting rate, time to report, real-threat reporting, click or risky-action rate, credential-submission rate, repeat-risk reduction, miss rate, completion SLA, and security incidents tied to trained topics. Completion proves coverage; the other KPIs show behavior change.
What is the most important security awareness training metric?
For most organizations, the most important metric is reporting rate because it measures positive user behavior. It shows whether employees are helping identify suspicious activity instead of only avoiding obvious mistakes.
How do you measure security awareness training effectiveness?
Measure effectiveness with a mix of behavior metrics: reporting rate, time to report, real-threat reports, click rate, credential-submission rate, repeat-risk reduction, miss rate, and incident trends tied to trained topics. Completion rate is useful, but it should not be the only measure.
What benchmarks should security teams use for training completion and click rates?
Use annual and onboarding completion requirements as a coverage baseline, then benchmark click rates, credential submissions, reporting rates, and time to report against your own historical baseline by scenario and cohort. Universal click-rate benchmarks can be misleading when campaign difficulty and audience risk differ.
What security awareness metrics should CISOs report to the board?
CISOs should report four to six trend metrics: completion coverage, reporting rate, time to report, risky-action rate, repeat-risk reduction, and real employee reports that led to security action. The board view should connect metrics to risk decisions and remediation, not campaign trivia.
Do completion rates still matter?
Yes. Completion rates matter for compliance, audits, insurance evidence, and onboarding discipline. They are useful supporting metrics, but they are not strong proof that employees are behaving more safely.
Should we still track phishing click rate?
Yes, but as a supporting metric. Click rate can help calibrate simulations and identify risk, but it should not be the main KPI because it is easy to misread and can encourage a punitive culture if used poorly.
What is phishing time to report?
Phishing time to report is the time between when a suspicious message arrives and when someone reports it. Lower time to report generally means faster detection and less opportunity for an attacker to expand the incident.
How do you evaluate security awareness training providers?
Evaluate providers by the metrics they can produce, how well they integrate with your security stack, whether they segment results by risk group, and whether they support remediation workflows, executive reporting, audit evidence, and real-threat reporting.
What are human risk metrics for security awareness programs?
Human risk metrics measure patterns that increase or reduce risk through employee behavior. Examples include repeat-risk rate, miss rate, reporting rate, risky-action rate, credential-submission rate, real-threat reporting, and improvement after coaching.
Does Datapath provide security awareness training services?
Yes. Datapath helps regulated and mid-market teams connect security awareness training, phishing simulations, Microsoft 365 reporting, human-risk metrics, manager follow-up, audit evidence, and executive dashboards into a managed cybersecurity operating rhythm.
Sources
- NIST SP 800-50 Rev. 1: Building a Cybersecurity and Privacy Learning Program
- NIST Cybersecurity Framework 2.0
- NIST: Measuring the Effectiveness of U.S. Government Security Awareness Programs
- CISA: Cybersecurity Performance Goals
- CISA: Recognize and Report Phishing